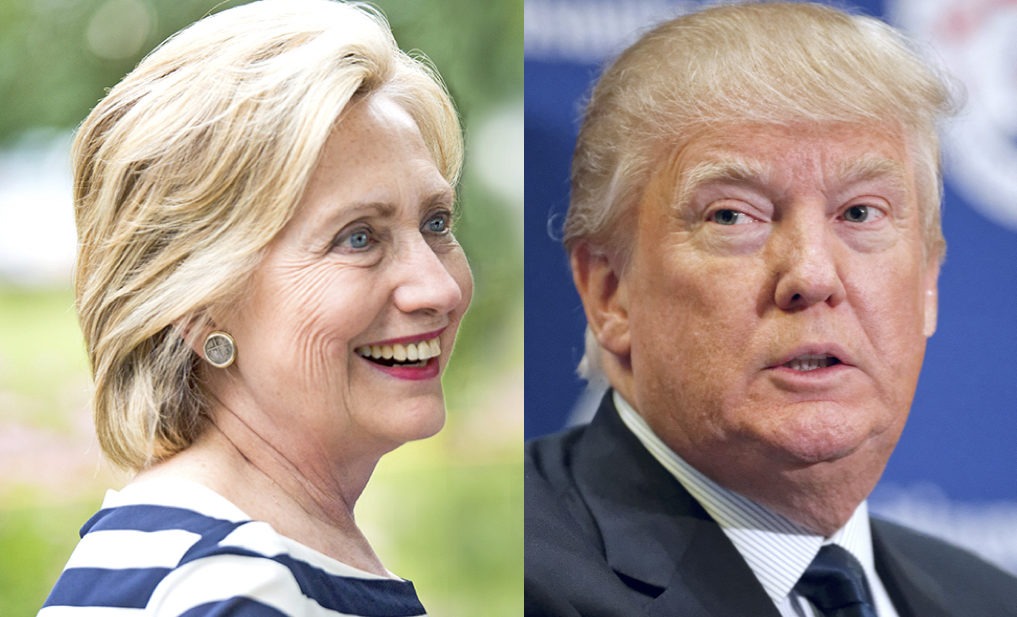
We told you the Donald Trump vs Hillary Clinton vote totals looked rigged. Now we know how it happened.

Back in mid-November of 2016, even as the shock of Donald Trump’s election victory was still sinking in, Palmer Report began documenting the various ways in which the voting results seemed “off” from a mathematical and statistical standpoint. It wasn’t merely that Trump won, but the way in which the numbers played out, that reeked of being nearly mathematically impossible. We took a lot of heat for it from competing news outlets on the left and right. But this week has finally provided a decent amount of clarity on the fact that Trump did indeed rig the election, and how he went about rigging it.
Palmer Report’s analysis focused on the four states where Trump pulled off improbable surprise victories that went sharply against the polls, even as the rest of the nation largely fell in line with the polls. Those four states were Michigan, Wisconsin, Florida, and Pennsylvania. We documented how it was statistically suspicious that Trump pulled off all four of those upsets by the same 1% margin, while a more realistic statistical distribution would have had him winning one of the states by 0.5%, another by 3%, another 1%, and so on (link).
We documented how Hillary’s early voting lead in Florida should have been mathematically insurmountable on election day (link). We also documented other mathematical unlikelihoods about the results (link).
At the time, the maddening thing about assembling our analysis was that we didn’t know why the results were so far skewed from mathematical reality. We ended up concluding that our own findings were a “mountain of statistical and mathematical and logical and demographic discrepancy and suspicion and nothing more.” Since that time we’ve seen the gradual unearthing of a mountain of evidence that the Donald Trump and Russia conspired to alter the outcome of the 2016 election, and we expect the Robert Mueller investigation will inevitably expose proof of this. In the meantime, this week we saw proof that the Trump campaign cheated in a different way, as its data analysis firm Cambridge Analytica stole Facebook user data from fifty million users and then used it as the backbone of its campaign strategy.
It’s not difficult to draw a logical straight line from the Donald Trump campaign stealing private user data from fifty million Americans, in an election that only had 130 million votes cast, to the mathematically unrealistic results we saw. At the least, the Trump campaign was micro-targeting voters in order to influence them into non-natural voting patterns, which helps explain why the numbers in the key swing states made no sense. It must be stressed that this cheating was carried about by the Trump campaign itself, in addition to whatever role Russia played. This still leaves the question of whether Russian hackers also changed the actual vote totals on election day, which would further explain the statistically nonsensical voting results we ended up with in those states. Fifteen months later, some crucial questions still need answered.
